
Manually tracking e-commerce data wastes time and risks outdated insights. Automating custom reports solves this by delivering accurate, up-to-date metrics on sales, inventory, and customer behaviour directly to your inbox.
Here’s the process in a nutshell:
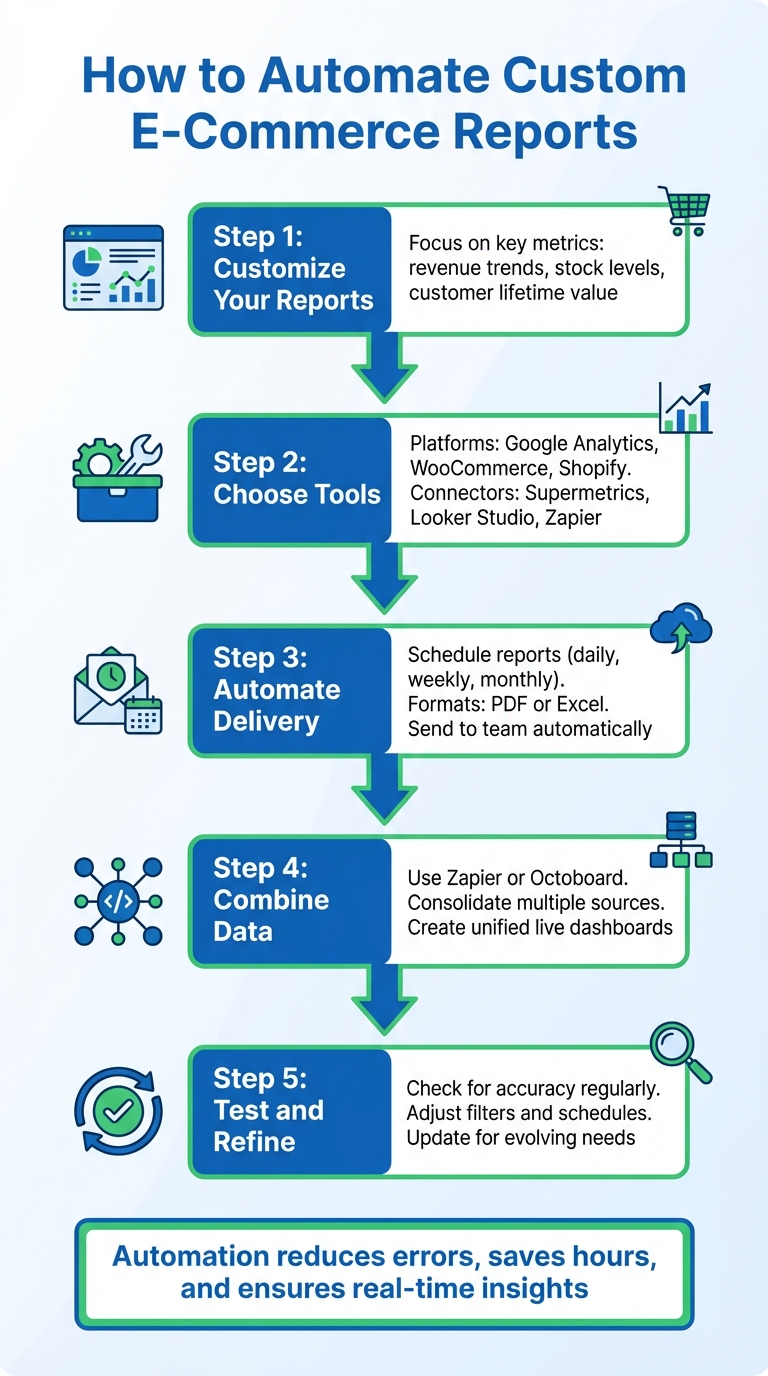
- Customise Your Reports: Focus on metrics that matter – like revenue trends, stock levels, and customer lifetime value.
- Choose Tools: Use platforms like Google Analytics, WooCommerce, or Shopify, along with connectors like Supermetrics or Looker Studio.
- Automate Delivery: Schedule reports in formats like PDF or Excel, and send them to your team on a set frequency (daily, weekly, etc.).
- Combine Data: Use tools like Zapier or Octoboard to consolidate data from multiple sources into live dashboards for a unified view.
- Test and Refine: Regularly check for accuracy, adjust filters, and update schedules for evolving business needs.
Automation reduces errors, saves hours, and ensures you act on real-time insights. Whether you’re tracking sales spikes or low inventory, automated reports keep your business agile and informed.
5-Step Process to Automate E-Commerce Reports
What You Need Before Starting
Before jumping into automation, you’ll need the right combination of tools, platform access, and basic technical know-how. The good news? Many tools offer free versions to help you get started.
Tools and Platforms You’ll Need
The tools you choose will depend on your data sources and how you prefer to view and analyse your metrics. For example, Google Analytics 4 (GA4) is a must-have for tracking website traffic and conversions, offering over 500 metrics for automated reporting [1]. Running a WooCommerce store? You’ll need access to its REST API to pull sales and product data [7]. If your business involves advertising products, Google Merchant Center is invaluable for tracking performance metrics like product visibility and ad campaign effectiveness [4].
To streamline the process and automate data delivery, you can rely on connector tools like the Google Sheets Add-on for Google Analytics, Two Minute Reports, Supermetrics, or Looker Studio (formerly Google Data Studio) [1][5][7]. For SEO and domain tracking, Semrush’s "My Reports" builder is a great option. It lets you create scheduled PDF reports or live dashboards – though live dashboards require a Pro subscription or higher [5].
When it comes to delivering reports, you have multiple options. Reports can be sent as scheduled emails in PDF or Excel formats, shared via dashboard links, or embedded as HTML iframes for client portals. If you’re looking for custom reporting integrations, Greenmor (https://greenmor.in) offers web development services tailored to your needs.
Of course, having these tools is just part of the equation. You’ll also need the right access permissions and a solid understanding of how to use them effectively.
Required Skills and Access
Once you’ve chosen your tools, the next step is ensuring you have the necessary access and permissions. For instance, if you’re working with WooCommerce, you’ll need to generate a REST API key with "Read" or "Read/Write" permissions to manage and schedule reports [7]. With Google Analytics, you’ll need your View ID (formatted as ga:12345678) or Property ID to extract specific data [10][11].
A basic understanding of data export processes is also crucial, particularly when working with APIs. As Jeff Sauer, Founder of MeasureU, points out:
"Just because you can dream it, doesn’t mean Google Analytics can do it… Not all metrics and dimensions work together, even in the API" [8].
This means you need to understand data scopes. For example, you can’t combine session-level metrics like conversion rate with product-level dimensions in a single API report [8]. To avoid compatibility issues, use tools like the "Metric and Dimension Explorer" to verify your data setup [8]. If you’re planning to transfer data into warehouses like BigQuery or MySQL, make sure you have the host, port, database name, and user credentials ready [10].
How to Set Up Automated E-Commerce Reports
After setting up your tools and securing access, the next step is crafting and automating your e-commerce reports. Here’s a simple guide to help you create, refine, and automate your custom reports.
Step 1: Build Custom Reports
Start by designing a report tailored to your needs. In Shopify, you can either begin with a blank slate or tweak default reports using the configuration panel, where you manually select metrics and dimensions [12]. WooCommerce allows you to filter and customise reports directly within the platform [13]. If you’re advertising products, Google Merchant Center provides a "Custom reports" add-on, enabling you to create personalised tables and charts with metrics like clicks, impressions, and CTR, which can then be saved to custom dashboards [4].
Google Analytics (GA4) is another powerful tool, offering over 500 metrics to track unique dimensions and KPIs, such as custom events or user interactions that standard reports might overlook [1]. For financial data, QuickBooks Online includes a "Custom Report Builder" (available with the Advanced plan), which lets you tailor invoices and payment reports and schedule them [16].
Once your report is built, you can further refine it by applying filters and formatting options.
Step 2: Refine and Format Your Reports
Fine-tune your report by adding filters and formatting the data. For Shopify users, filters are constructed using three elements: the column name (e.g., "Billing city"), an operator (like "is" or "is not"), and specific values [14]. The "one of" operator is particularly handy for including data that matches any selected values [14].
WooCommerce provides "Quick Filters" and "Advanced Filters" next to the date range picker, and you can hide unnecessary columns using the table header menu [6]. It also allows you to toggle between line and bar charts and adjust intervals (day, week, month, or quarter) based on the date range [6]. In QuickBooks, you can customise reports through areas like General, Rows/Columns, Filter, and Header/Footer. For example, you can format numbers to match Indian standards, such as displaying currency as ₹1,23,456.78 [15].
To ensure accuracy, exclude "Pending" or "Failed" orders from your exports, so your financial and inventory reports only reflect successful transactions [13]. In Shopify, you can save a filtered report for future use by clicking "Save as" [14]. WooCommerce users can include past customer and order data in new reports by using the "Import Historical Data" feature [6].
With your report polished, the final step is to automate its delivery for timely insights.
Step 3: Automate Report Delivery
Automating your report delivery ensures you receive updates without lifting a finger. In QuickBooks Online, navigate to the "Custom reports" tab, select "Edit", and toggle the "Set email schedule" option [16][15]. You can choose delivery frequencies such as daily, weekly, monthly, or quarterly, and attach reports as Excel files or PDFs [16][15]. For monthly reports, set the "Next Date" to the 1st of the following month to capture all transactions from the previous month [16]. You can also send reports to multiple recipients by separating email addresses with a comma and a space [15].
In Google Analytics, use the "Share" button on your dashboard to input recipient emails, subject lines, and delivery frequency [1][9]. Reports are usually sent as PDF attachments, and you can schedule them to remain active for up to 12 months [9]. For GA4 users, tools like Google Data Studio or the Google Sheets Analytics add-on may be needed for automated email reports [1].
| Platform | Navigation Path | Key Scheduling Feature | Available Formats |
|---|---|---|---|
| QuickBooks Online | Reports > Custom Reports > Edit | Set email schedule toggle | Excel, PDF |
| Google Analytics | Dashboard > Share | Frequency drop-down | |
| Shopify | Analytics > Reports | Save as custom report (Export for manual) | CSV, Excel |
Keep in mind that automated report scheduling is not available in the QuickBooks Online Simple Start plan [15]. For WooCommerce, use incremental exports when syncing reports with external systems to avoid duplicating data [13].
Combining Data from Multiple Sources
Once you’ve automated reports from individual data sources, the next step is bringing together multiple streams to get a complete view of your business. Imagine your e-commerce data is scattered across platforms – Shopify for sales, Google Analytics for website traffic, and Facebook Ads for marketing expenses. To make sense of it all, you’ll need tools that consolidate this data into one location. Connector tools like Supermetrics, Zapier, and Octoboard can pull data from these separate systems into a single destination, such as Google Sheets, Looker Studio, or Excel, giving you a unified perspective.
Connect Multiple Data Sources
To begin, select a connector tool that fits your requirements. For instance, Supermetrics supports over 170 pre-built data sources and can cut manual data export time by nearly half [19]. Setting it up involves three straightforward steps: linking to your data source via API (e.g., connecting your Shopify store), specifying the metrics and dimensions you want (like "Amount Spent" from Facebook Ads and "Transactions" from Shopify), and choosing where the data should go – whether that’s Google Sheets, Excel, or a dashboard tool.
Zach Stuck from Homestead Studio emphasises the value of custom fields, which help businesses make quicker, more informed decisions. For example, integrating metrics like First Time Impression Ratio and Average Order Value into a single view can be a game-changer [17].
Zapier, which connects over 6,000 apps, is particularly useful for automating workflows. You can set up conditional alerts, such as automatically notifying your supplier when Shopify inventory falls below a certain level [17][20]. Both Supermetrics and Octoboard offer a 14-day free trial, while Zapier provides a free basic plan. To keep your data current, schedule reports to refresh hourly, daily, or weekly [18]. When exporting data to Google Sheets, use the "Append to import" setting to maintain a historical log instead of overwriting past entries [22].
Set Up Live Dashboards
Once your data is consolidated, bring it to life with real-time dashboards. These dashboards give you instant insights into your business performance. Octoboard, for example, offers over 350 templates, including multi-currency reporting and daily FX conversions – perfect for businesses managing revenue in ₹ alongside international sales [21]. Its "Mashup Widgets" combine data from multiple channels, like PPC, SEO, and sales, into unified visualisations. Dashboards can be displayed on office screens or shared through client portals, creating what Octoboard refers to as a "Business Centre" for real-time insights [21].
Modern tools now use AI and machine learning to detect trends automatically. These technologies, powered by OpenAI, can flag significant shifts in customer behaviour or sales patterns [21][24][25]. You can also configure automated alerts through Slack, email, or Microsoft Teams to notify you when specific metrics hit predefined thresholds [21][23]. Joy Huynh, Content Strategist at Supermetrics, notes:
"Having more ecommerce analytics data doesn’t mean having better insights" [18].
The goal is to build dashboards that highlight actionable trends. For example, tracking metrics like "Product adds to cart", "Product checkouts", and "Exit rate" can help pinpoint where customers encounter obstacles in their journey [18].
Here’s a quick look at some key tools and their features, particularly useful for Indian businesses:
| Tool | Primary Strength | Key Feature for Indian Businesses | Trial Period |
|---|---|---|---|
| Supermetrics | Data extraction & transformation | Custom fields for metrics like AOV in ₹ | 14 days |
| Octoboard | Real-time dashboards & AI insights | Multi-currency reporting (150+ currencies) | 14 days |
| Zapier | Workflow automation | Inventory alerts to suppliers | Free basic plan |
sbb-itb-3716372
Test and Improve Your Automated Reports
Test Your Report Delivery
When setting up automated reports, always test their functionality using features like the "Send Now" option (available in tools like Looker Studio Pro or Semrush). This ensures that the reports are delivered on time, the data is accurate, and the formatting is correct [26][5]. If you don’t receive the test email, check your spam or junk folder [27].
It’s a good idea to manually download the report and cross-check it with standard reports to confirm consistency [2][1]. For instance, compare your customised report to the default Acquisition Report on the platform. Since Google Analytics provides over 500 metrics, focus only on the most relevant ones during testing to avoid data misinterpretation [1].
Make sure all recipients have proper access permissions, as even one unauthorised account can disrupt the report schedule. Keep in mind that Looker Studio has limits: you can send scheduled emails to a maximum of 50 recipients, with daily and monthly caps of 200 and 800 emails respectively [26]. For larger teams, consider sharing live dashboard links instead.
Monitor and Adjust Your Reports
Once you’ve confirmed the reports are being delivered correctly, make it a habit to monitor them regularly to ensure ongoing reliability. Review report performance every week and use filters – such as region, traffic source, or campaign – to identify trends. For example, you might notice a surge in traffic from Mumbai during Diwali. Add annotations to your reports to explain any unusual data shifts, such as server outages, updates, or marketing campaigns [2].
You can also create custom properties tailored to your business needs. For instance, HubSpot allows setting a 7-day overdue shipment threshold [3]. Adjust reporting thresholds and frequency as your business evolves – switching from monthly to daily reports during flash sales is a good example [1].
Take a close look at conversion funnels to spot where users drop off. If many abandon their carts at the payment stage, check for issues with tracking codes. AI-generated summaries can provide quick insights, and sharing reports across departments can help identify any anomalies [5][2].
Conclusion
Automating custom e-commerce reports can transform how you manage data – saving time, cutting errors, and speeding up decision-making. By automating data extraction, you can get precise insights delivered straight to your inbox or live dashboards. The process is simple: define the metrics that matter, apply filters to segment your data, schedule automatic deliveries, and keep an eye on performance to ensure everything is running smoothly.
The advantages are clear. Studies show employees spend nearly half their time on repetitive tasks [29]. Automation not only reduces this burden but also allows your team to focus on more impactful work – like designing smarter marketing strategies, enhancing customer experiences, or identifying new opportunities for growth. Companies embracing automation are already reaping the rewards: AI-powered workflows can complete tasks up to 15 times faster than manual efforts, with far fewer errors [29]. These time savings empower teams to focus on strategic goals.
Real-world examples highlight the impact of automation. Brian Burke from RenewedMacs.com used automated fraud-prevention workflows to cancel risky orders, helping cut shipping costs. Similarly, Adam Davis, formerly with Magnolia Bakery, automated tagging for birthday purchasers, successfully driving repeat sales [28].
Start with straightforward, high-impact reports before moving to more complex dashboards. Focus on ensuring high data quality and use clear, descriptive report titles (e.g., "Monthly Mumbai Traffic Report"). Collaborate with your team to confirm you’re tracking metrics that truly matter [29][2].
Whether you’re running a small online shop or managing a large e-commerce platform, automated reporting can give you a competitive edge. With 64% of employees struggling to complete their workload in the time available [29], automation isn’t just a convenience – it’s a necessity for sustainable growth. By integrating automation, you can turn your data into a powerful tool for success. If you’re looking for expert assistance, Greenmor’s web development services can help create a solution tailored to your needs. Get started with your first automated report today and see how much easier data-driven decision-making can be.
FAQs
What are the benefits of automating e-commerce reports for your business?
Automating e-commerce reports can be a game-changer for businesses in India, offering a blend of time-saving convenience, improved accuracy, and smarter decision-making. With automation, reports can be generated on a fixed schedule, cutting out the hassle of manual data exports and minimising errors. This means you’ll always have up-to-date insights into crucial metrics like revenue, conversion rates, and average order value (AOV).
Another major perk? Faster decision-making. Real-time data allows you to spot trends early and adjust campaigns swiftly. Plus, automated reports can be customised to reflect your brand’s style and easily scaled to cover multiple product lines or stores as your business expands. This way, your team can dedicate their energy to strategy and growth, rather than getting bogged down by repetitive tasks.
Greenmor offers tailored reporting solutions designed to meet your specific business requirements while adhering to Indian standards, ensuring that your reports are both effective and dependable.
What tools do I need to automate custom e-commerce reports?
To streamline the automation of custom e-commerce reports, you’ll need the right mix of tools for gathering, analysing, and sharing data. Here’s a breakdown of some key resources:
- Shopify’s reporting features: Leverage Shopify’s built-in tools to generate and export customised reports as a starting point for automation. These features can provide a solid foundation for your reporting needs.
- Google Analytics (GA4): Set up automated reports with specific metrics and dimensions tailored to your business. These reports can be scheduled to arrive directly in your inbox or viewed on your dashboard.
- Hevo Data: Use Hevo Data to connect your e-commerce store, advertising accounts, and analytics platforms. This tool helps streamline data pipelines, ensuring your reports are both accurate and efficient.
- Coupler.io: Automate the process of pulling data from platforms like Shopify and Google Analytics into tools like Google Sheets. This ensures your reports are always up-to-date and ready for analysis.
By combining these tools, you can simplify your reporting process, save time, and gain insights that are tailored to the specific needs of your e-commerce business in India.
How can I make sure my automated e-commerce reports are accurate and reliable?
To make sure your automated e-commerce reports are both accurate and dependable, start by identifying the data sources and metrics you need. For instance, decide which tables, APIs, or apps (like orders, website traffic, or ad spend) will supply data for your reports. Use tools specific to your platform to filter out unnecessary fields and save only the essential ones before setting up automation.
Before diving into full automation, take a moment to validate your report manually. Export the data into a spreadsheet and cross-check key numbers, such as total sales (₹1,23,456.78) or the total number of orders (1,234), against the raw data. This step helps you catch potential errors early. Once everything checks out, set up a schedule for report delivery – daily or weekly is a good starting point – to avoid overwhelming the system.
Keep an eye out for anomalies, like a sudden spike in sales (e.g., ₹2,00,000.00 on 15-08-2025), and adjust your filters or settings if needed. Regular audits are a smart way to fine-tune the process and ensure continued accuracy. If you need expert guidance, Greenmor can help you set up and streamline this workflow for reliable and consistent reporting.